The Complete Facebook Ads Audit Checklist (2026)
The only checklist you need to audit any Facebook ads account in 2026. Ten ordered sections, yes-or-no checks, free printable PDF. Built on $150M+ in managed ad spend.
Founder, BTB Audits. $150M+ in ad spend managed across Meta and Google
| Section | Checks | What it catches |
|---|---|---|
| 1. Dashboard hygiene | 7 | Default column view, missing date range, wrong attribution setting |
| 2. Pixel and CAPI | 8 | Bad data, duplicate events, low Event Match Quality |
| 3. Campaign structure | 6 | Junk-drawer accounts, copy-of-copy waste, retargeting mixed with prospecting |
| 4. Naming convention | 5 | Names a new team member cannot read |
| 5. Account stage | 5 | Cost-cut accounts run with a scaling playbook |
| 6. Budget allocation | 6 | Top spend not matching top return, learning-phase starvation |
| 7. Cross-platform check | 8 | Meta-Shopify gap, broken mobile checkout, UTM drift |
| 8. Testing and signal | 8 | Multi-variable tests, no hypothesis, audience overlap |
| 9. Creative | 8 | One pitch with ten variants, no video, landscape on mobile |
| 10. Competitor benchmark | 6 | Account run in a vacuum, no structural copy |
Meta reported 3.58 billion family daily active people in their Q4 2025 results, with ad impressions up 12% and average price per ad up 9% for the full year. More people, more impressions, but each impression costs 9% more than it did 12 months ago. Wasted ad spend in 2026 hurts more than it did in 2025. An audit that misses leaks is an audit that lets the higher CPMs eat the brand's margin. This checklist exists so that no leak hides.
Why the standard 27-point audit misses real leaks
The most-cited Facebook ads audit checklist in 2026 is the 27-point checklist from Common Thread Collective. It is a good checklist. It groups checks into five sections: basics, structure, targeting, performance, and creative. It works.
But it is missing three things that cost real money in 2026.
First, there is no data-trust gate. The 27-point audit checks campaigns and creative before it checks whether the data is even real. If the Pixel is misfiring, every campaign-level finding is a finding about fiction. Section 2 of this checklist is a gate. Until the data passes, the rest of the audit is paused.
Second, there is no cross-platform check. The 27-point audit checks what Meta says. It does not check whether Meta and Shopify agree. The biggest leak in most 2026 accounts lives between the ad and the cash register: a broken mobile checkout, a discount code attribution gap, a UTM that does not carry through. Section 7 of this checklist is that bridge.
Third, there is no account-stage diagnostic. A 2.8x return on ad spend (ROAS) means three different things in three different accounts. In a scaling account, 2.8x is a win because it means more new customers. In a cost-cut account, 2.8x is a loss because the brand is losing money on every order. The 27-point audit treats 2.8x as one number. Section 5 of this checklist treats it as three.
Add it up: a complete checklist with ten ordered sections, a data-trust gate, a cross-platform bridge, and an account-stage diagnostic. The full 10-step method behind each section is explained in the Facebook ad audit method post. This page is the checklist version of that method — for the operator who already knows the why and just needs the line items.
How to use this checklist
The checklist works one of three ways.
Run it on a calm afternoon. Block four to six hours, open Ads Manager, and walk through the sections in order. Tick each box as a yes or a no. Write the leak next to each "no" in a notes app. At the end, the leaks are listed and the fix order is obvious.
Run it as a recurring monthly check. Set a calendar repeat for the first Monday of every month. Walk only the sections most likely to drift: 2 (Pixel and CAPI), 6 (budget allocation), 8 (testing), and 9 (creative). The rest only need an audit per quarter.
Hand it to a junior on the team. A junior can run sections 1, 3, 4, and 10 without supervision. Those four sections are pattern-recognition, not judgment. The senior runs the other six. This is how an in-house team scales audits without bottlenecking on one person.
A printable PDF version of every check is available at the top of this post. The interactive checklist at /resources/facebook-ads-audit-checklist saves progress locally so the audit can be paused and picked back up the next day.
Section 1: Dashboard hygiene
The Ads Manager dashboard is where every decision starts. If the dashboard is not set up for honest reading, every downstream decision is biased. This section is fast — five minutes at most — and it is the first signal of whether anyone has been managing the account.
- 1.1 The column view in Ads Manager is custom. The default 3-column view is not in use.
- 1.2 The custom column view shows, at a glance: CPM (cost per thousand impressions), CTR (click-through rate), CPC (cost per click), CPA (cost per acquisition), ROAS (return on ad spend), and AOV (average order value).
- 1.3 Date range is set to last 28 days at minimum. A 90-day window is open in a second tab for trend reading.
- 1.4 Attribution setting is fixed and consistent across all open Ads Manager tabs (default: 7-day click).
- 1.5 The "All campaigns" view shows both active and paused campaigns (the "Inactive" toggle is off, so paused work is visible).
- 1.6 Multi-attribution comparison view has been checked at least once in the last 30 days (7-day click vs. 1-day click side by side).
- 1.7 Breakdown by placement (feed, Reels, Stories, audience network) is reviewed at least once per audit cycle.
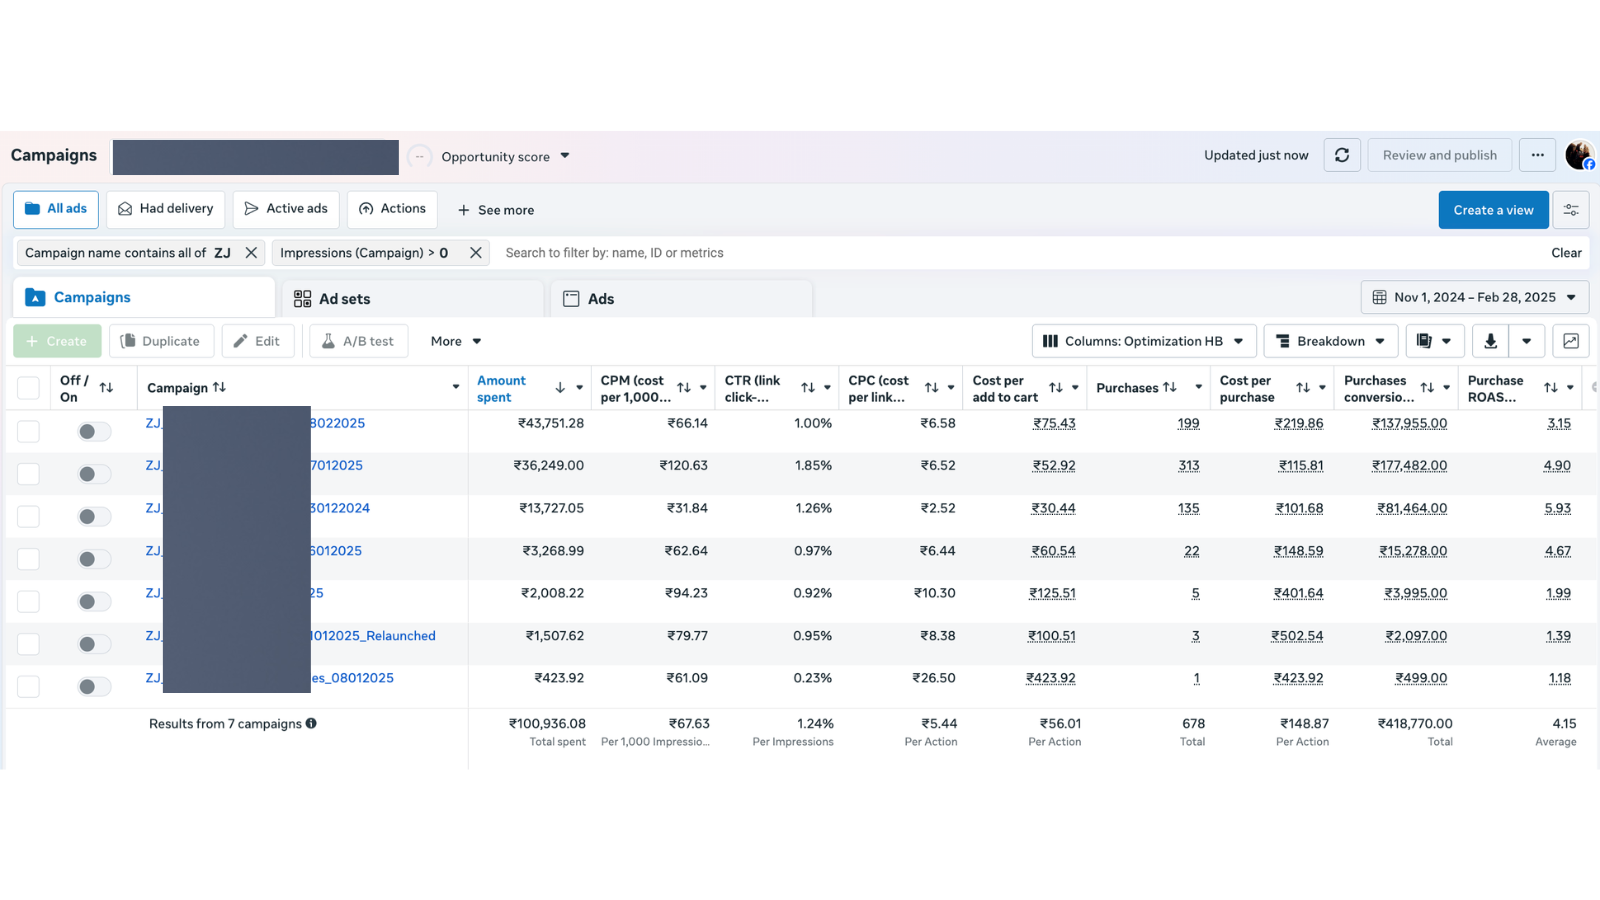
What section 1.2 passes look like in a real account. Every yield and cost metric readable without a click.
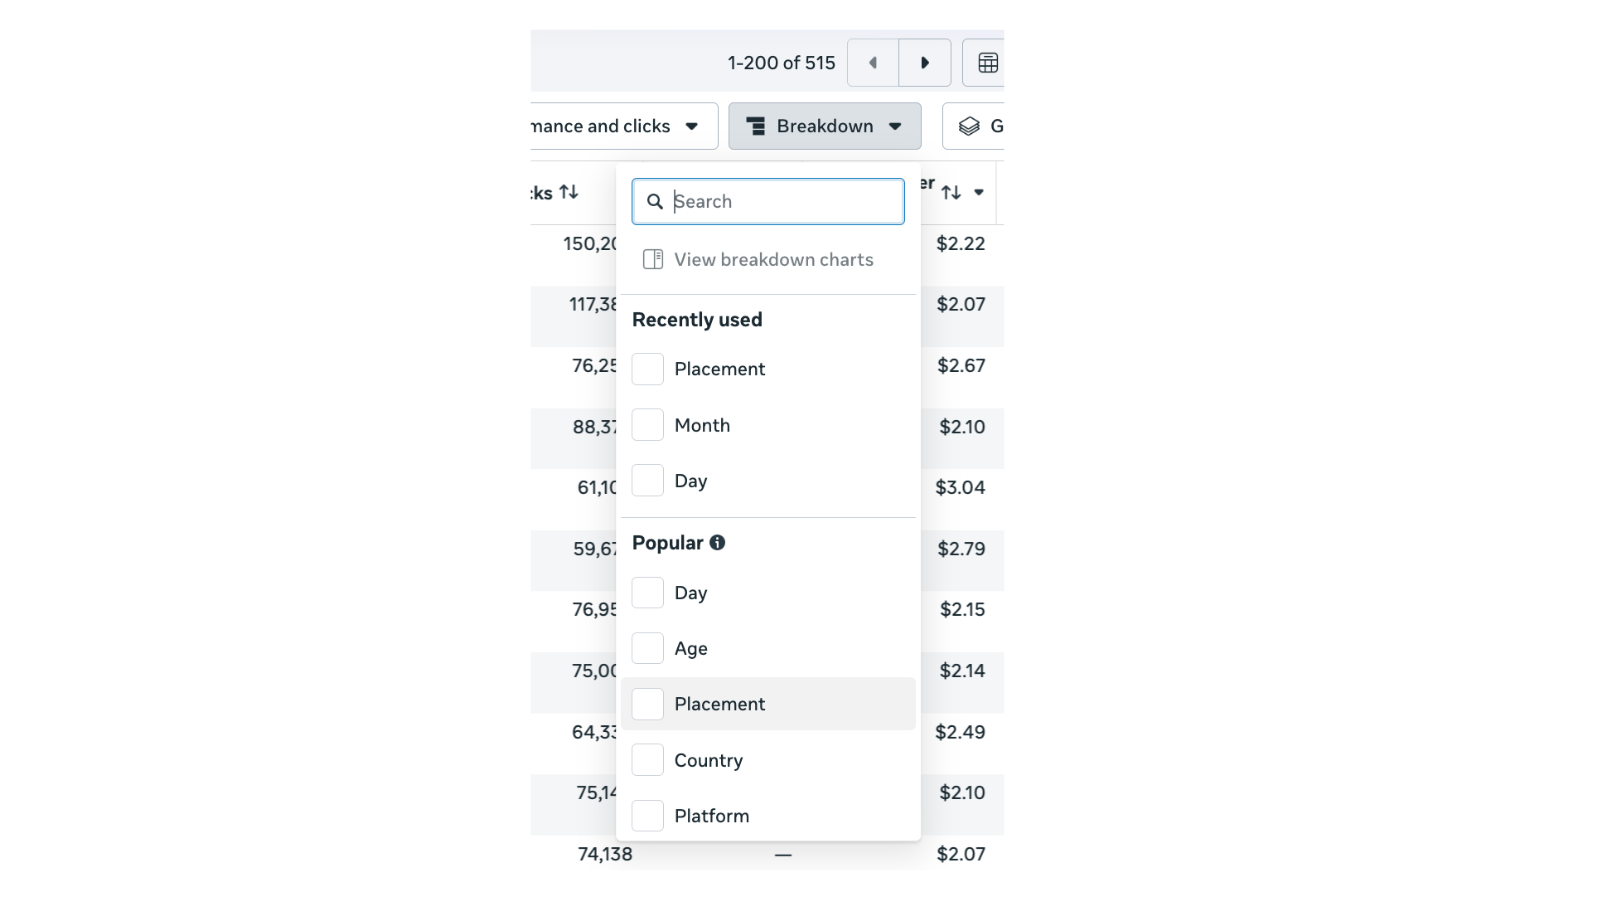
The Breakdown menu (section 1.7). Placement is the one that reveals how spend is distributed across feed, Reels, Stories, and audience network.
What the Breakdown by Placement reveals. Notice how CPM and CTR vary by surface. This is also where section 9.7 (mobile-first format check) gets validated.
Section 2: Pixel and Conversions API
This is the data-trust gate. Until the data is trusted, the rest of the audit is paused. A misfiring Pixel turns every later finding into noise. Section 2 is the longest section of the audit for a reason — it is the most important one.
If any check in this section fails, fix it before running sections 3 through 10. The detailed setup walkthrough is in the Conversions API setup and deduplication guide.
- 2.1 A Meta Pixel ID is set on the website, matched to the active Business Manager.
- 2.2 The Meta Pixel Helper Chrome extension shows zero red errors on the homepage.
- 2.3 The Meta Pixel Helper shows zero red errors on a product detail page.
- 2.4 The Meta Pixel Helper shows zero red errors on the checkout (and confirmation) page after a test purchase.
- 2.5 Conversions API (CAPI, the server-side version of the Pixel) is sending the same events as the browser Pixel.
- 2.6 Each key event (ViewContent, AddToCart, InitiateCheckout, Purchase) fires exactly once per user action — no doubles, no skips.
- 2.7 Event Match Quality (EMQ) score is 6.0 or higher for the Purchase event.
- 2.8 Pixel and CAPI events are deduplicated — Meta is not double-counting Purchase events from the two sources.
Section 2.2 in action. The Meta Pixel Helper popup on a real DTC site, showing both active Pixels firing with no red errors. This is the 30-second version of the section 2 check.
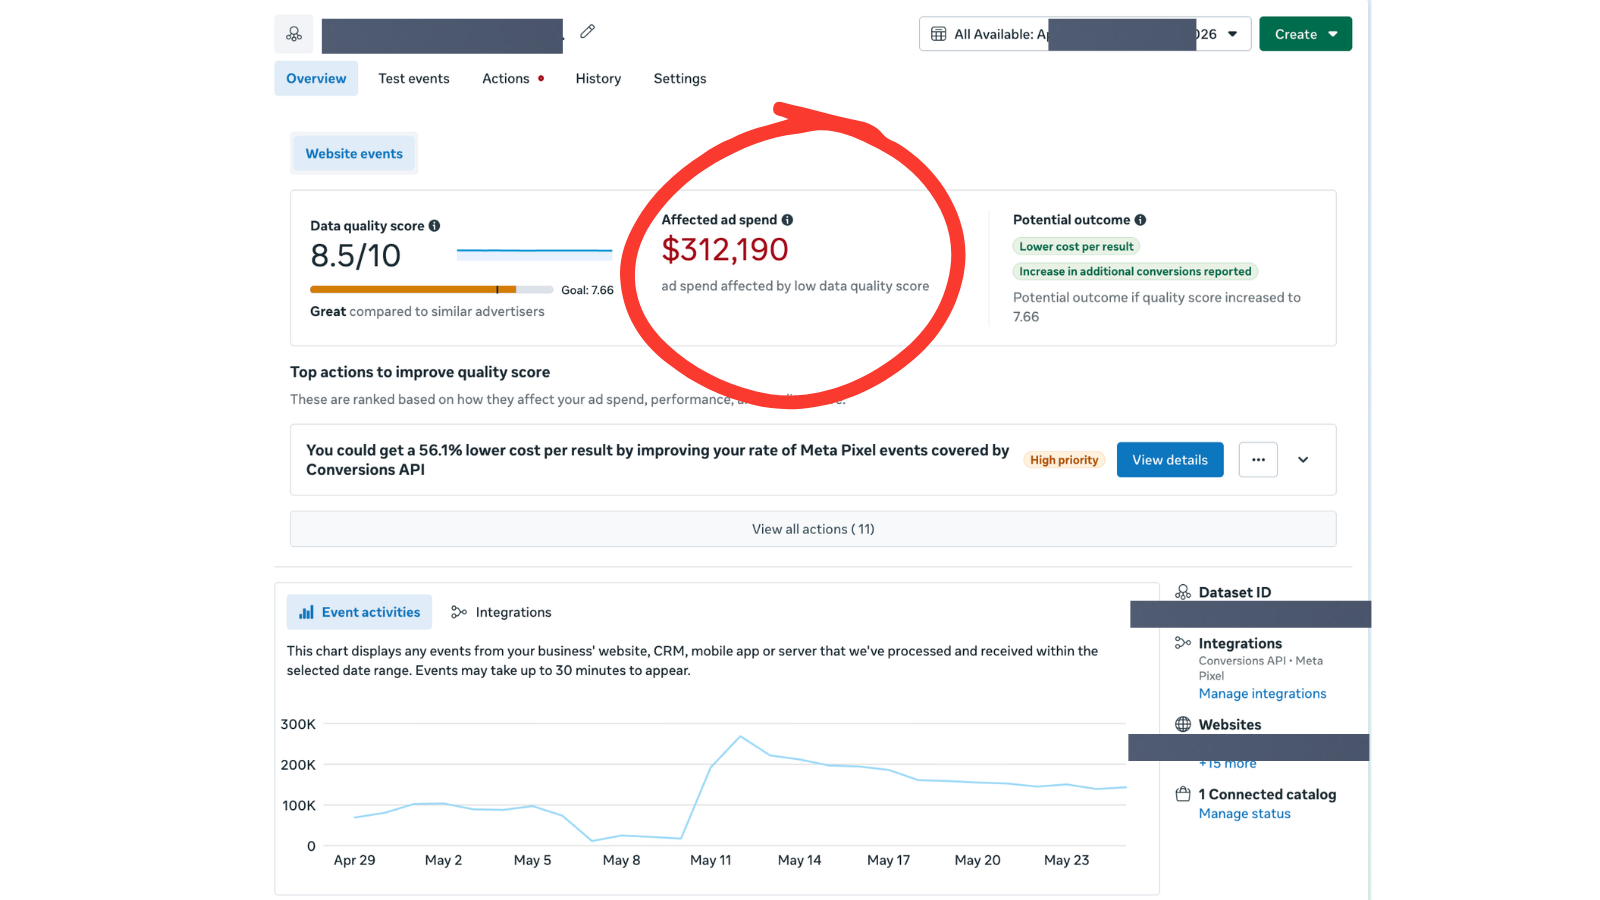
Section 2.7 — Event Match Quality. The dollar number on the right ($312,190 of ad spend affected by low data quality) is why this check matters more than any other in section 2.
Section 3: Campaign structure
Structure is the bones of an account. Clean structure means decisions are fast. Junk-drawer structure means every reporting question takes 30 minutes to answer. The 6 checks below test whether the account was designed, or whether it just accumulated.
- 3.1 The number of active campaigns is under 10. (Most accounts overcomplicate. Fewer, larger campaigns let the algorithm exit learning.)
- 3.2 Each campaign maps to one clear thing: one product category, one funnel stage, or one objective.
- 3.3 Zero campaigns have "Copy" or "Copy 2" in the name. (Copy-of-copy waste is a sign of unplanned launches.)
- 3.4 The campaign structure roughly mirrors the website's category structure (e.g. if the site has 5 categories, there is at least one campaign per category that drives meaningful revenue).
- 3.5 Retargeting (warm audiences) and prospecting (cold audiences) are in separate campaigns, not the same ad set.
- 3.6 Advantage+ Shopping (ASC) campaigns, if used, are isolated in their own campaign — not mixed with manual campaigns competing for the same audience.
Section 4: Naming convention
A name should tell a story without the campaign being opened. If the name does not, every reporting question takes a click into the ad set. Five checks catch whether names were designed or whether they were just typed.
- 4.1 All campaign names follow the same template (a documented format, not freeform).
- 4.2 Each campaign name reveals: objective, category, audience type, demographics, and launch month.
- 4.3 Each ad set name reveals: targeting type, audience source, and exclusions if any.
- 4.4 Each ad name reveals: creative type, hook variant, and creator or source.
- 4.5 A new team member could read 10 campaign names and explain the account without opening anything.
Section 5: Account stage
Every recommendation depends on the account stage. A 2.8x ROAS is a win for a scaling account and a loss for a cost-cut account. The same finding means different things. These 5 checks force the stage to be named before the audit grades anything.
Full breakdown of what each stage looks like and how to manage it is in the four account stages guide.
- 5.1 The account stage has been named in writing: scaling, optimizing, or cost-cutting.
- 5.2 The ROAS target matches the stage. (Scaling = lower acceptable ROAS, cost-cut = higher acceptable ROAS.)
- 5.3 The choice between CBO (campaign budget optimization) and ABO (ad set budget optimization) matches the stage and the budget volume.
- 5.4 Spend volume is appropriate for the stage. (Scaling needs a minimum of $5K per week per campaign to exit learning.)
- 5.5 The time horizon for results is written down: scaling = 60-90 days, optimizing = 30 days, cost-cut = 14 days.
Section 6: Budget allocation
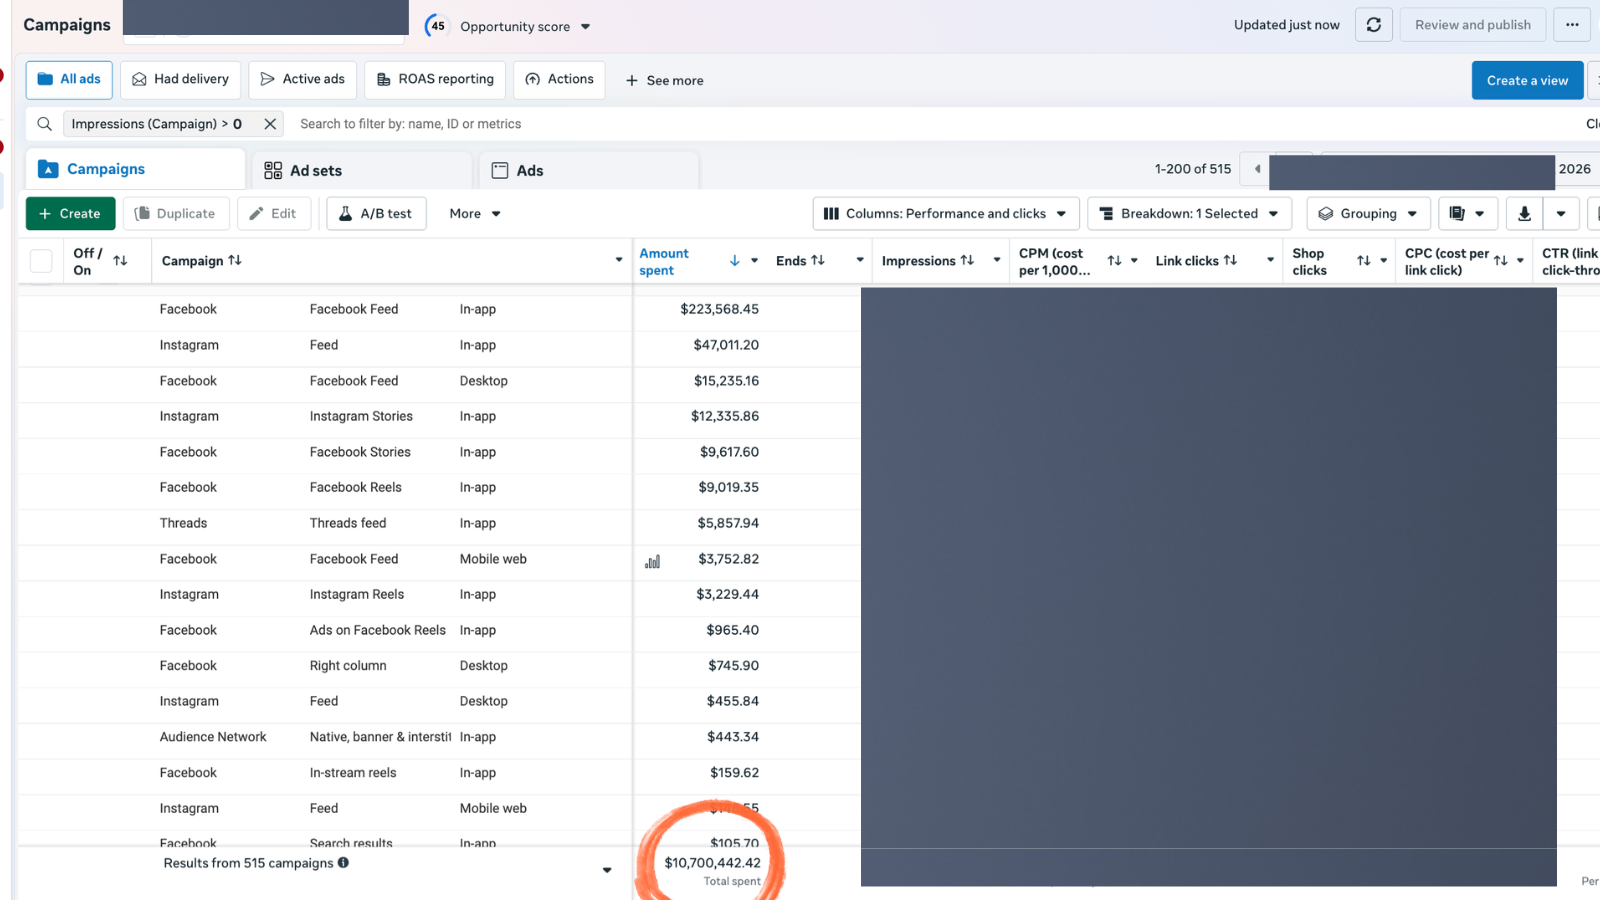
The hardest leak to find. A budget can look reasonable in total and still be misallocated. The top 30% of campaigns should drive 30% or more of revenue. If they do not, the budget is being eaten by losers.
- 6.1 The top 30% of campaigns by spend drive 30% or more of returns. (If the top 30% drives less than 30%, the budget is upside-down.)
- 6.2 No campaign has zero conversions in the last 14 days while still spending money.
- 6.3 Each ad set has a daily budget of at least 5x the target CPA. (Lower than 5x, the algorithm cannot get out of the learning phase.)
- 6.4 A budget shift has been made in the last 14 days based on performance data (the budget is not stagnant).
- 6.5 No ad set has a frequency above 3.5 in the last 14 days without a creative refresh in the same period.
- 6.6 Underperforming ad sets are paused on a fixed rule (e.g. zero conversions after 3 days and $50 spent, kill the ad set).
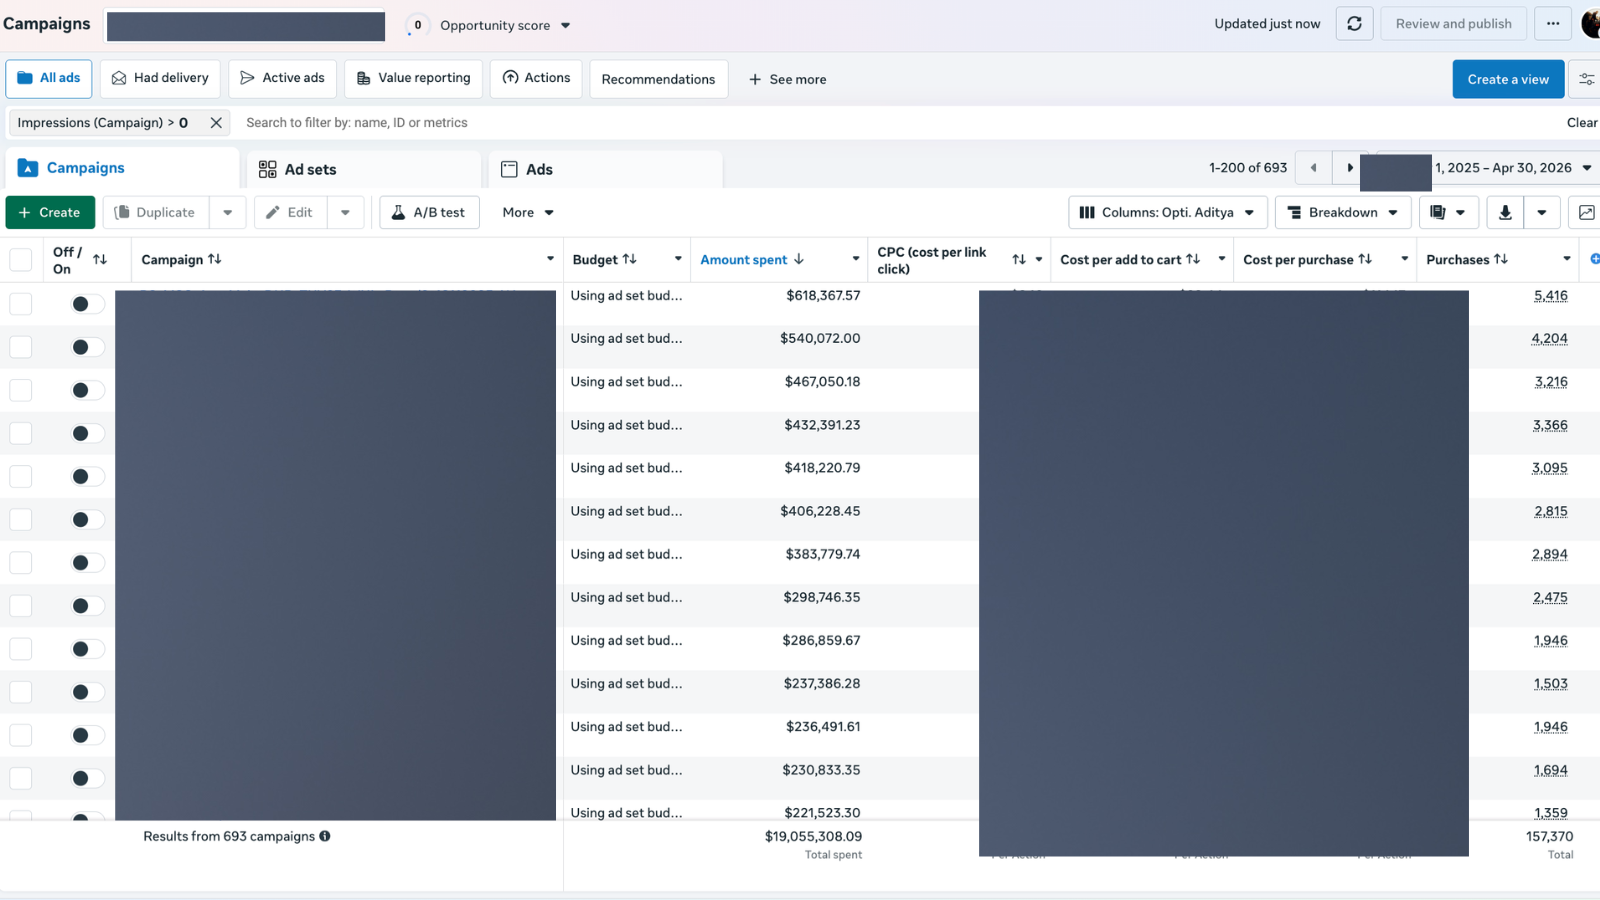
Section 6.1 in practice. Sort by Amount spent and the top 30% of campaigns should be driving 30% or more of returns. The cost-per-purchase column on the right is where the check actually gets graded.
Section 7: Cross-platform reality check
This is the bridge between what Meta says and what is actually happening at the cash register. Most leaks in 2026 live here, not in Ads Manager. Pull Shopify, GA4, and Meta side-by-side and reconcile.
Detailed breakdown of common attribution gaps is in the Conversions API setup and deduplication guide.
- 7.1 Meta-reported revenue and Shopify-reported revenue (last 28 days) are within 25% of each other.
- 7.2 The direction of the gap is documented. (Meta usually over-reports by 10-25% because of view-through and cross-device. A gap in the other direction is a different problem.)
- 7.3 Google Analytics 4 (or whichever analytics tool the brand uses) reports revenue within 10% of Shopify.
- 7.4 Mobile vs. desktop conversion rate on Shopify is checked. Desktop more than 1.5x mobile is a red flag for a broken mobile checkout.
- 7.5 A test purchase has been completed on a mobile device in the last 30 days, manually, by a real person.
- 7.6 UTM parameters (utm_source, utm_medium, utm_campaign) are consistent across all Meta ads — no missing or malformed tags.
- 7.7 No critical 404 or page-load failures have been logged on the destination URLs in the last 14 days.
- 7.8 Discount code attribution between Meta and Shopify matches. (Meta-only codes should only appear on Meta-attributed orders. If a Meta code is on organic orders, attribution is leaking.)
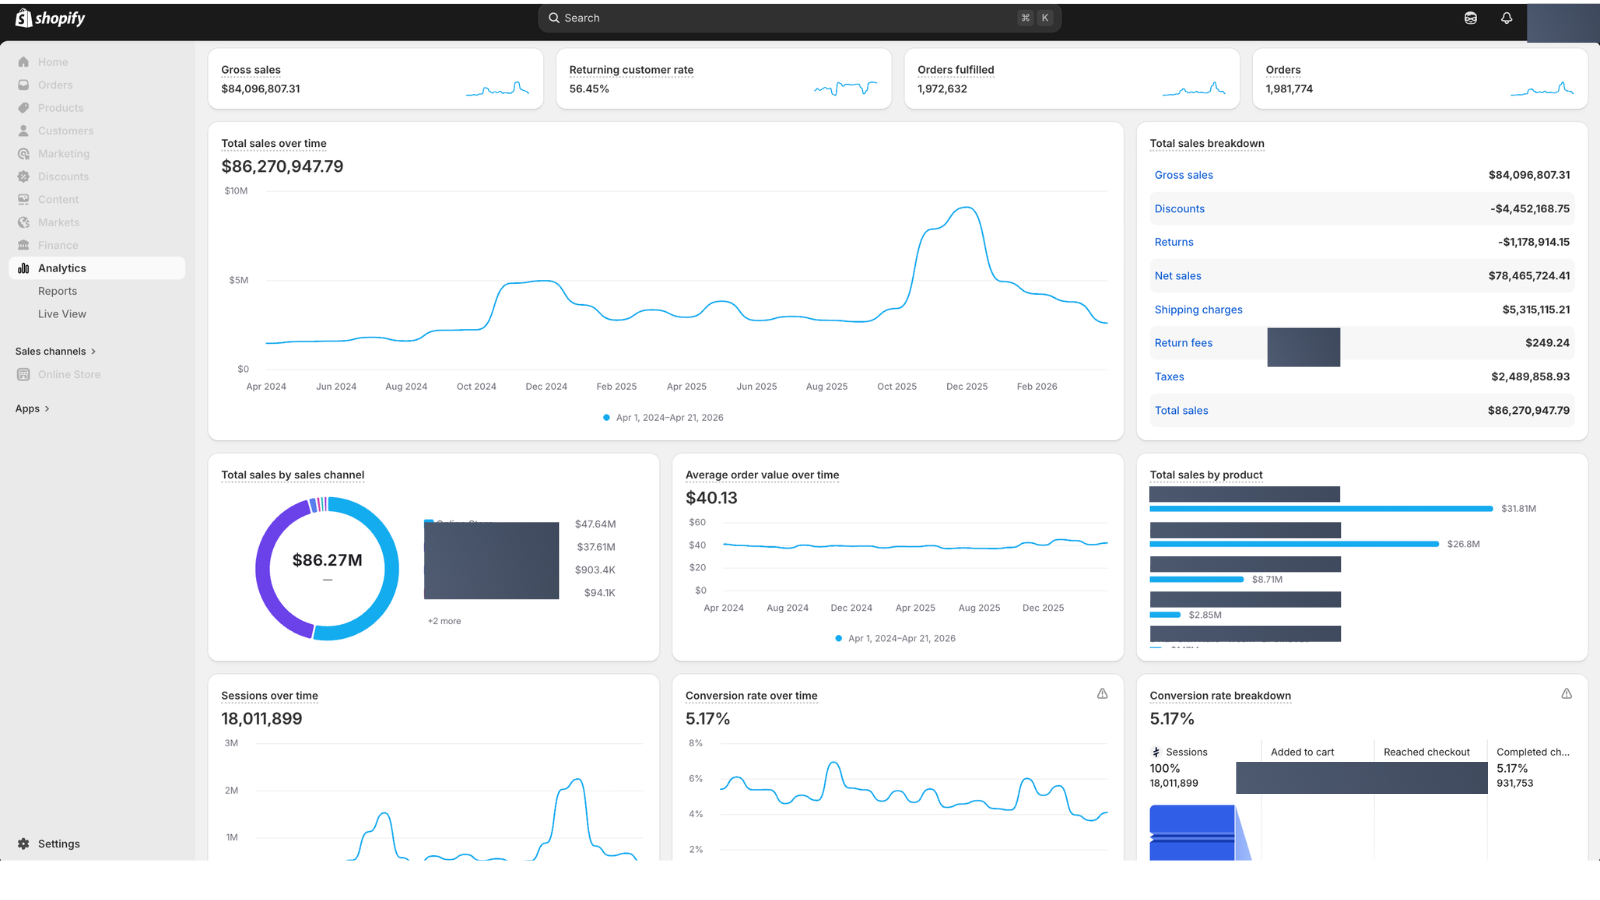
The Shopify side of the section 7.1 reconciliation. This is the number Meta should be within 25 percent of for the trailing 28 days.
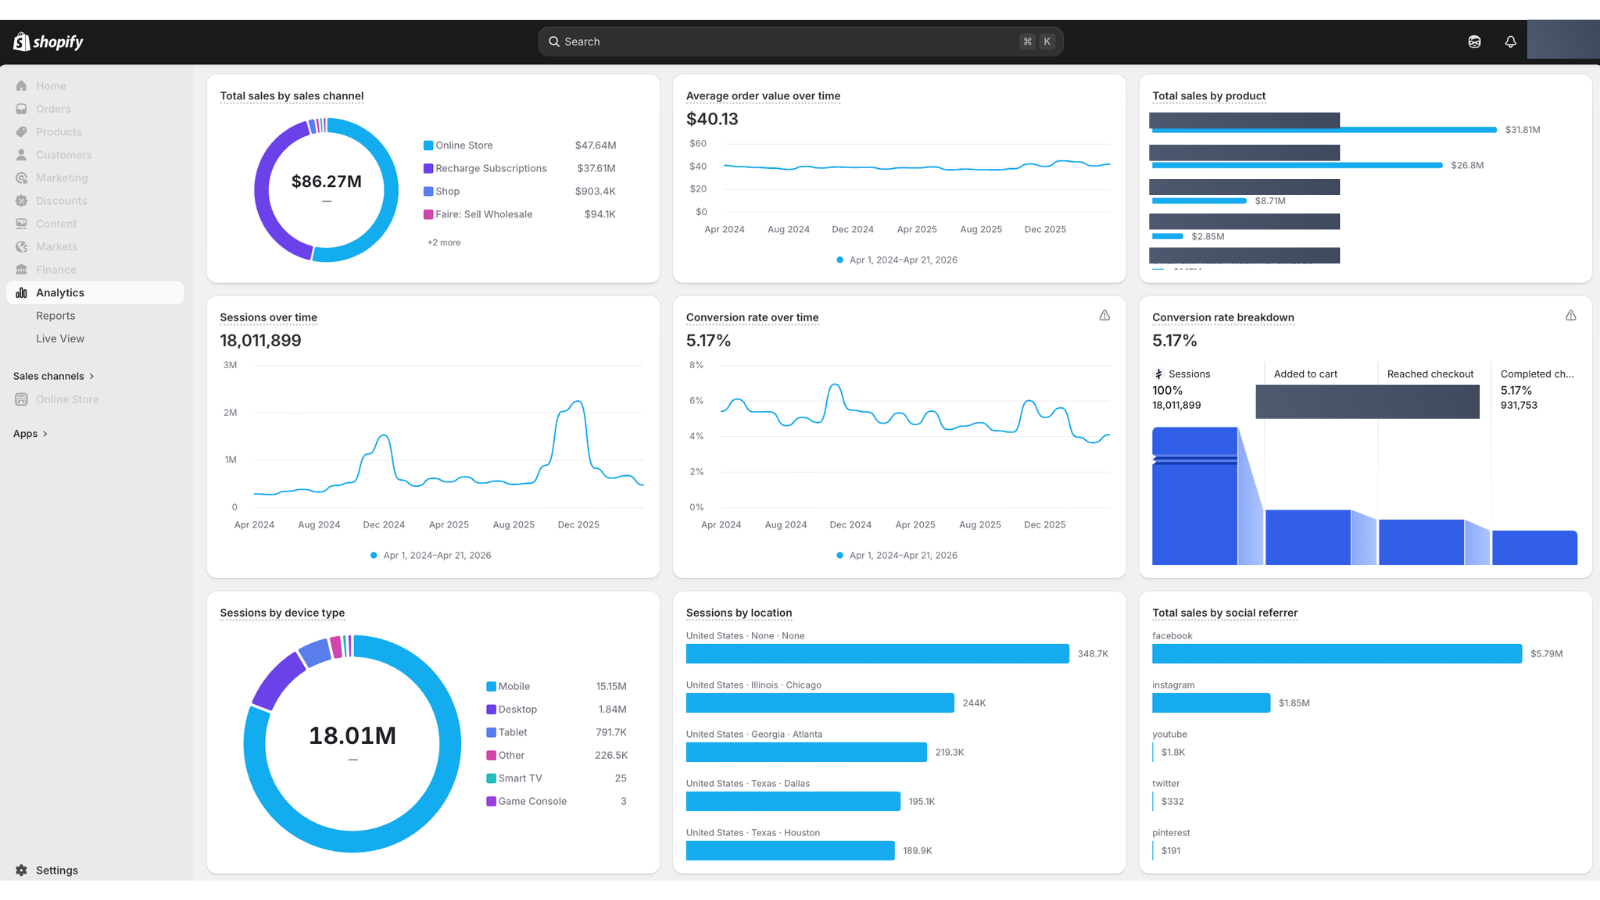
Section 7.4 — sessions by device. A 15M vs 1.6M mobile-desktop split means a broken mobile checkout silently leaks roughly 9x more revenue than a broken desktop one.
Section 8: Testing and signal hygiene
The difference between learning and noise. Most "testing" in 2026 accounts is just running variants without a hypothesis. These 8 checks force the testing to be disciplined.
- 8.1 Audience overlap between active ad sets is below 30% (checked via Audience Insights overlap tool).
- 8.2 Creative tests change one variable at a time: hook, visual, or call-to-action — not all three at once.
- 8.3 Each creative test has a written hypothesis before launch (e.g. "Hook B will beat Hook A by 20% on CTR because B leads with a price anchor").
- 8.4 Each creative test has a written decision rule before launch (e.g. "If after 1,000 impressions and $50 spent, B is winning, kill A").
- 8.5 No new ad set is launched without a clear hypothesis tied to the previous winner.
- 8.6 No test is killed before 1,000 impressions and $50 spent. (Below that, the result is noise, not signal.)
- 8.7 Lookalike audiences are rebuilt every 90 days from a refreshed seed list.
- 8.8 Custom audiences (purchasers, add-to-cart, page viewers) are refreshed when their size grows by more than 25%.
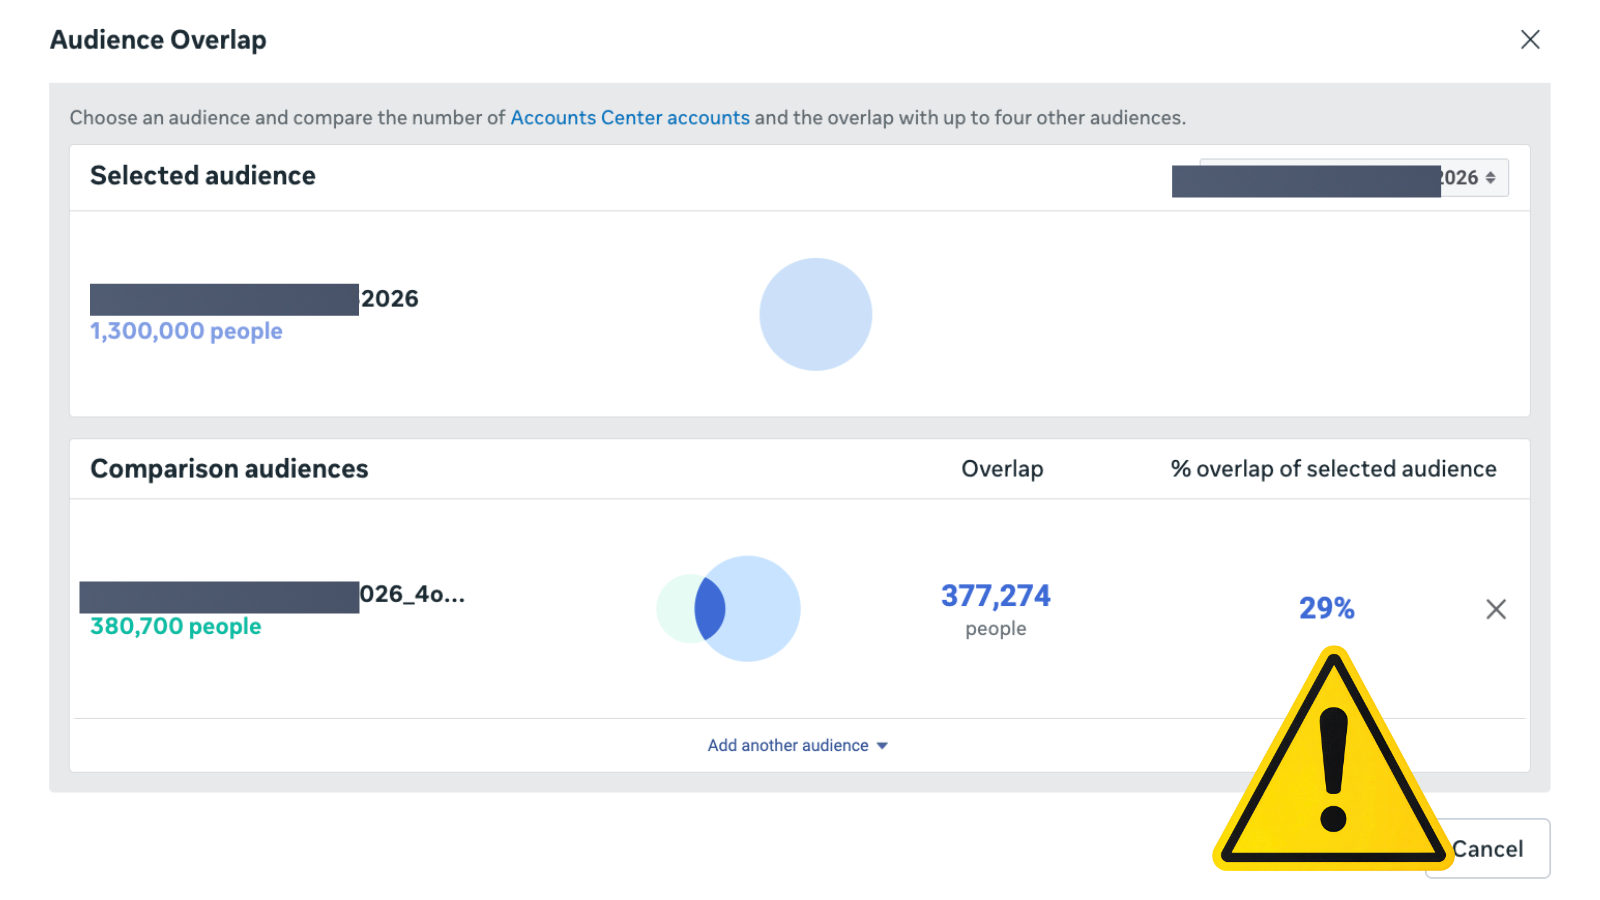
Section 8.1 — bad. 29% overlap means two ad sets are bidding against each other on the same people.
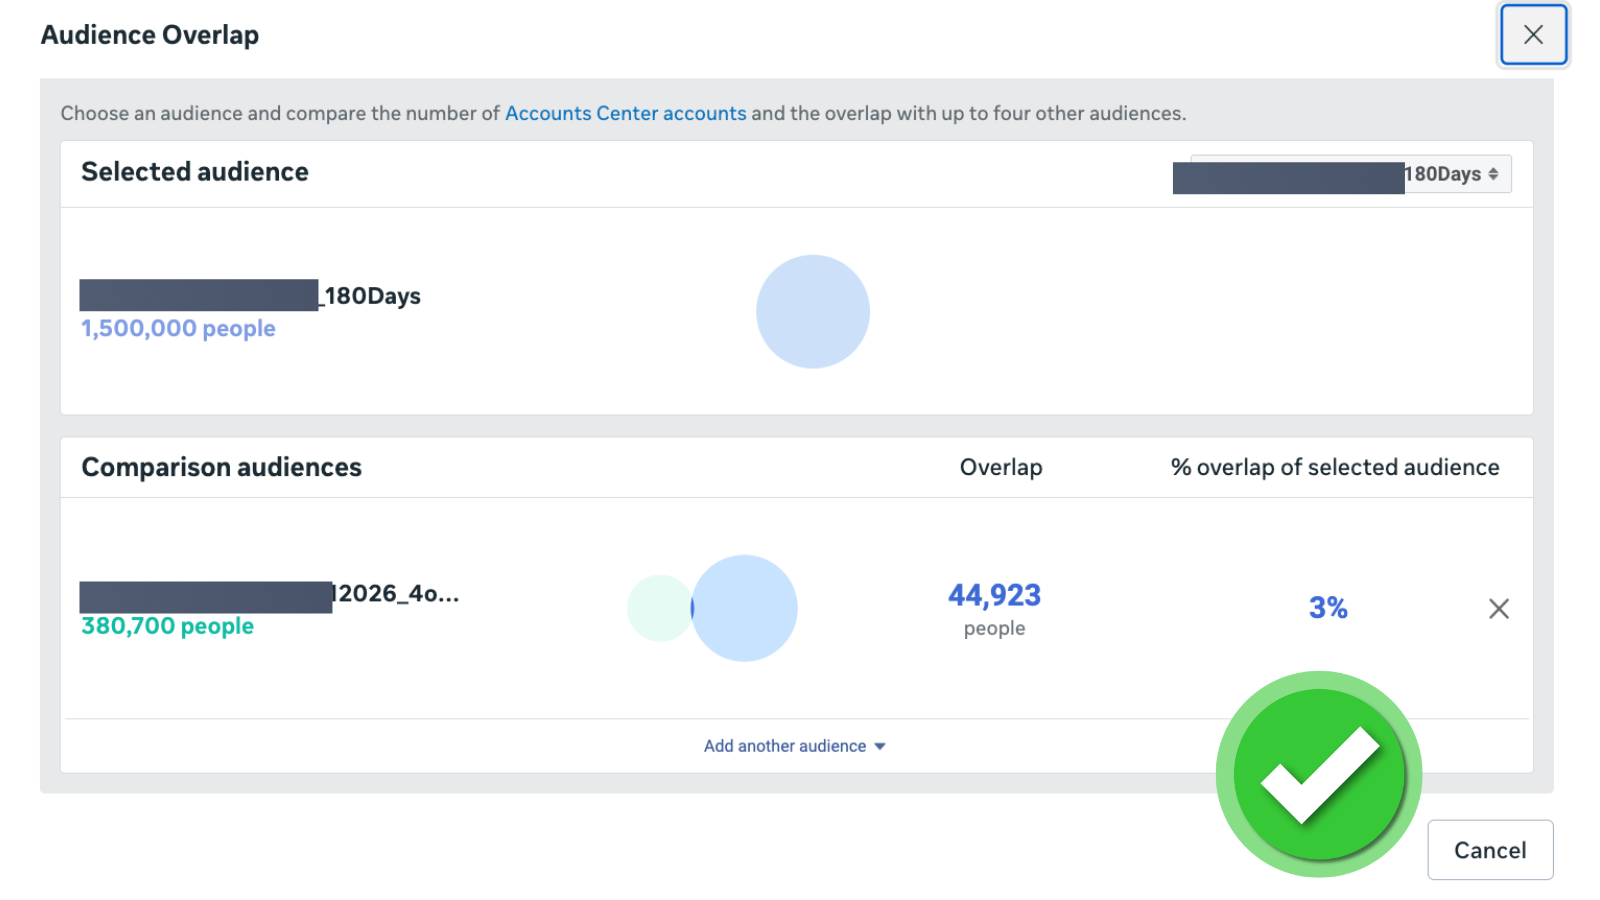
Section 8.1 — good. 3% overlap. Ad sets are reaching distinct audiences. The check passes.
Section 9: Creative and communication
Creative is the new targeting in 2026. The algorithm picks the audience; the creative sorts it. Eight checks make sure the creative is doing its real job and not just being pretty.
The full breakdown of why creative is the lever in 2026 is in creative is the new targeting.
- 9.1 The account has at least 5 distinct hook variants active. (Not one hook with 10 visuals.)
- 9.2 Each campaign has at least 3 distinct creative angles (problem, social proof, demonstration, etc.).
- 9.3 Both UGC (user-generated content) and studio content are represented in the active creative set.
- 9.4 At least 1 active video creative per campaign, under 15 seconds.
- 9.5 The first 3 seconds of every video state the value proposition (not the brand name, not a logo, not a soft intro).
- 9.6 All ad copy reads at a 5th-grade level or below. (Short sentences, plain words, one idea per paragraph.)
- 9.7 Mobile-first creative formats (vertical 9:16, square 1:1) outnumber landscape 16:9.
- 9.8 The call-to-action (CTA) on each ad matches the CTA on its landing page. (No bait-and-switch.)
Section 10: Competitor benchmark
The Meta Ad Library is free and public. Almost no in-house team uses it. Six checks make sure the account is not running in a vacuum.
- 10.1 The Meta Ad Library has been pulled for 3 named competitors in the last 30 days.
- 10.2 At least 1 structural move from a competitor (campaign type, audience exclusion, creative angle) has been replicated and tested.
- 10.3 Competitor ad longevity (how long each ad has been running) is documented. (Ads running 90+ days are usually winners worth studying.)
- 10.4 Competitor offer structures (discount, free shipping, bundle, subscription) have been compared against the brand's own offer.
- 10.5 Competitor landing pages (the URLs their ads point to) have been screenshotted and reviewed.
- 10.6 A competitor angle map is documented: what hooks they use, what proof they lean on, what objections they handle.
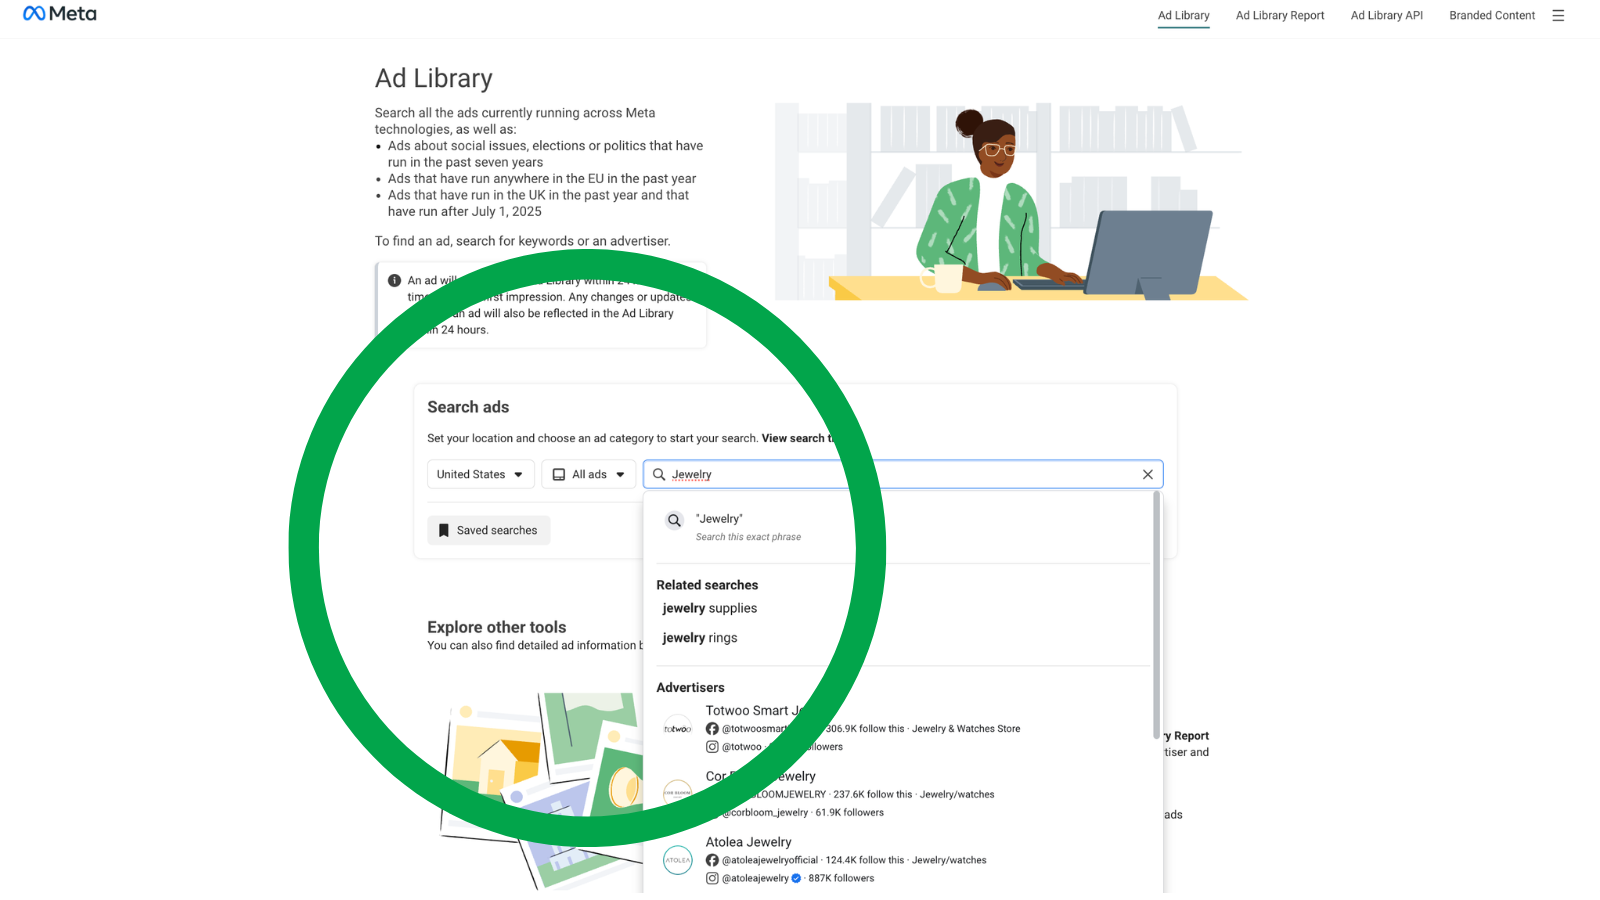
Section 10.1 starts here. The Meta Ad Library is free, public, and underused. Type a competitor name or a category keyword to begin.
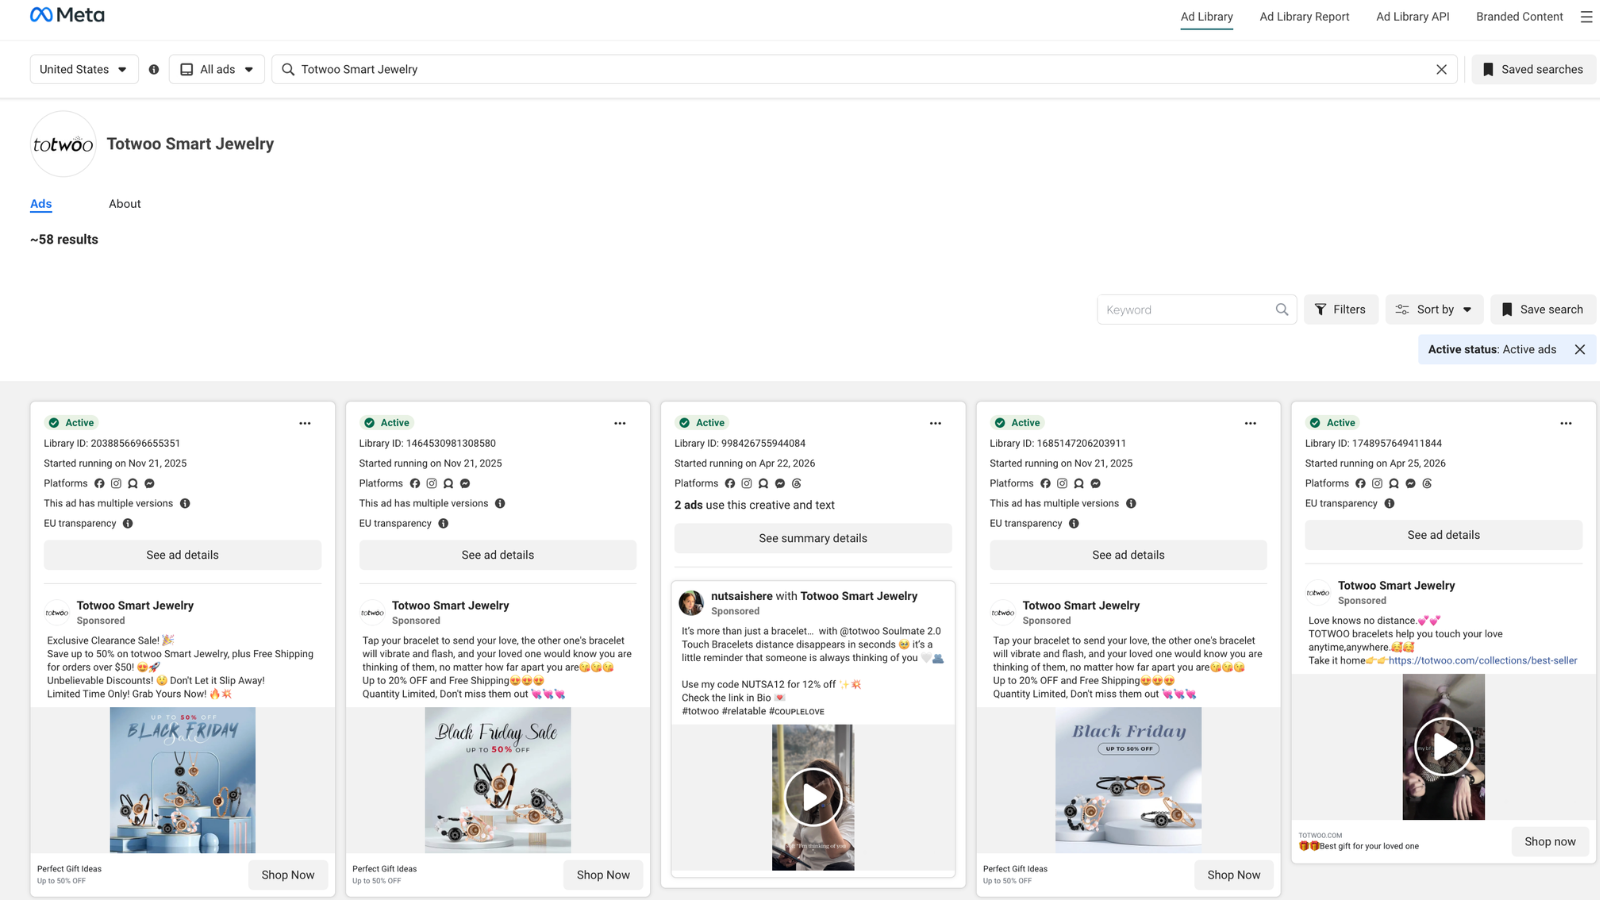
What section 10.1 and 10.3 look like in practice. 49 active ads, "Started running on" dates visible on each tile. Ads running 90 days or longer (the bottom rows) are the ones worth studying.
Scoring the audit
Count the boxes. There are 67 total.
| Boxes checked (out of 67) | Account health | What to do next |
|---|---|---|
| 60-67 | Healthy. Few real leaks. | Focus on creative volume and offer testing. The structural work is done. |
| 45-59 | Mid-tier. Real leaks but not bleeding. | Fix the 'no' boxes in order. Start with section 2, then sections 6 and 7. |
| 30-44 | Leaky. Wasting meaningful spend. | Pause new spend increases. Run sections 2, 7, and 5 immediately. |
| 0-29 | Account is auditing fiction. | Do not optimize anything until section 2 (Pixel and CAPI) passes. Every other action is noise. |
The score is not the point. The point is the list of "no" boxes. A score is just a way to know whether the list is short or long. A short list of "no" boxes that includes section 2 failures is worse than a long list that does not.
What to fix first when checks fail
The order matters. Fixing section 9 before section 2 is wasted effort because the creative findings are based on bad data. Fix in this order, regardless of where the leaks live:
- Any "no" in section 2 (Pixel and CAPI). Until data is trusted, nothing else matters. Stop running ads if section 2 fails by more than 2 checks.
- Any "no" in section 7 (cross-platform). A 30%+ Meta-Shopify gap or a broken mobile checkout costs more than any in-account problem.
- Any "no" in section 5 (account stage). Without a named stage, the rest of the recommendations are calibrated against the wrong target.
- Any "no" in section 6 (budget). Bad data, bad bridge, and wrong stage are above this in the priority order, but budget waste is the biggest in-account leak.
- Sections 1, 3, 4, 8 in any order. These are quality-of-life fixes. They make the account easier to read and decide on. They do not move spend by themselves.
- Sections 9 and 10 last. Creative and competitor work compounds slowly. Do it after the structural fixes have given the algorithm clean signal.
This checklist is the line-item version of the full method. The deep diagnostic — with examples, before-after comparisons, and category-specific notes — lives in the method post.
For founders who want a focused operator to run the audit on their account, the Free Quick Scan covers it. A 5 to 7 minute Loom walks through the leaks found on the account using public data only. Delivered in 48 hours. No account access needed.
Get Your Free Quick Scan →Frequently asked questions
Common questions
About this checklist
How is this different from the standard 27-point audit?
The most-cited Facebook ads audit checklists in 2026 are between 25 and 27 items. They skip three things that cost real money: a data-trust gate, a cross-platform reconciliation step, and an account-stage diagnostic. This checklist adds those three sections with enough checks per section to actually catch the leak. There is no padding — every check has a specific failure mode in the wild.
Is this checklist for 2026 specifically, or evergreen?
Mostly evergreen, but tuned for 2026. Three changes from a 2024 audit: Event Match Quality scores now matter more than they did pre-iOS 14.5; Advantage+ Shopping (ASC) campaigns are isolated from manual campaigns in section 3; mobile-first creative is a hard pass-fail in section 9. The other sections have been stable for years.
How long does the full audit take?
Four to six hours for a focused operator who knows the account. Longer the first time because most of the work is rebuilding the column view and the campaign naming so the rest of the audit is even readable. After the first run, monthly check-ins (sections 2, 6, 8, 9 only) take about 45 minutes.
Using the checklist vs. the method post
What is the difference between this checklist and the method post?
The method post explains why each step matters and what good and bad look like. The checklist is the line-item version: every step compressed to yes-or-no checks for fast reading. Read the method post once to understand the order. Then run the checklist every quarter.
Should this checklist replace the standard 27-point Common Thread Collective audit?
It can. The 27-point audit is a great starting checklist, especially for accounts under $20K per month. Above that, the missing seven leaks (data trust, cross-platform, account stage) start to cost real money. This version catches those.
Edge cases
Does the checklist work for lead-gen, not just ecommerce?
Yes. Two adjustments: in section 7, swap Shopify reconciliation for CRM (HubSpot, Salesforce, etc.) reconciliation. In section 9, the CTA-match check (9.8) becomes form-completion-language match instead of add-to-cart language match. The other checks work as-is.
What if the account is below $10K per month — is the full checklist worth it?
Honestly, no. Below $10K per month, the highest-leverage moves are in creative volume and offer testing, not structural fixes. Run sections 2 (Pixel and CAPI) and 9 (creative). Skip the rest until spend is higher.
What if the brand runs both Facebook and Google ads — does this checklist cover Google too?
No. Google has its own ordered method, and its own 12-section checklist linked at the end of this post. The Facebook checklist and the Google one share the same logic (data trust first, cross-platform check, account stage), but the line items are different.
About the printable PDF
Is the PDF version actually a downloadable PDF, or a link?
A real, printable PDF. All checks organized by section, with check boxes that can be ticked in pen or in a PDF reader. Designed to be printed and clipped to a clipboard. Download link is at the top of this post.
Does the interactive version save progress?
Yes. The interactive checklist at /resources/facebook-ads-audit-checklist saves progress to the browser. The audit can be paused on Monday and picked back up Tuesday without losing the boxes already ticked. No account, no signup required.
For the structural explanation behind each step of this checklist — what good and bad look like, what the most common leak in each section is, and why the order matters — see the full Facebook ad audit method post. For the difference between what a free audit and a paid forensic audit each catch, see free Facebook ads audit vs paid. For the Google equivalent, see the Google ads audit method, or run the complete Google Ads audit checklist (2026) if you want the line-item version. To check the CPM range for accounts that look like yours, use the Meta CPM benchmark lookup.
Keep reading on Facebook ads audits
Aditya Chaturvedi is the founder of BTB Audits. He has managed $150M+ in ad spend across Meta and Google for DTC, SaaS, and lead-gen brands ranging from $10K/month to $500K/month. The checklist on this page is the line-item version of the same diagnostic BTB Audits runs on every Forensic Report. Read more on the BTB Audits blog.